Example use case
The toy dataset is not real data. It contains real SNPs and gene info, but no real individuals It was created for testing and evaluating the pipeline only. In this example use case, we use the toy dataset to generate gene-based scores, association analysis and machine learning models.
Annotations and PLINK files
(Click here to download)
Annotations file
(filename: toy_vcf_data.tsv)
The annotated file contains information about the SNPS, gene, deleteriousness score and allele frequency. It should also contain samples genotypes. This information is important for the calculation of the gene-based scores.
Plink binary files
(filenames: toy_data.bed, toy_data.bim, toy_data.fam)
The binary files contains all genotype information for the cohort.
Gene-based scores
The gene-based scores can be found here. These scores are used as input for the association analysis and as features for the machine learning models.
Association analysis
We performed linear regression on the qunatitative phenotype and a logistic regression on the binary phenotype. Results can be found here.
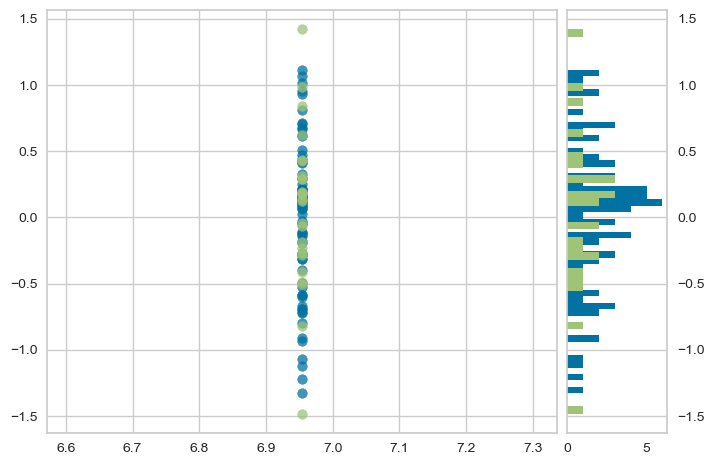
The QQ-plot of quantitative phenotype:

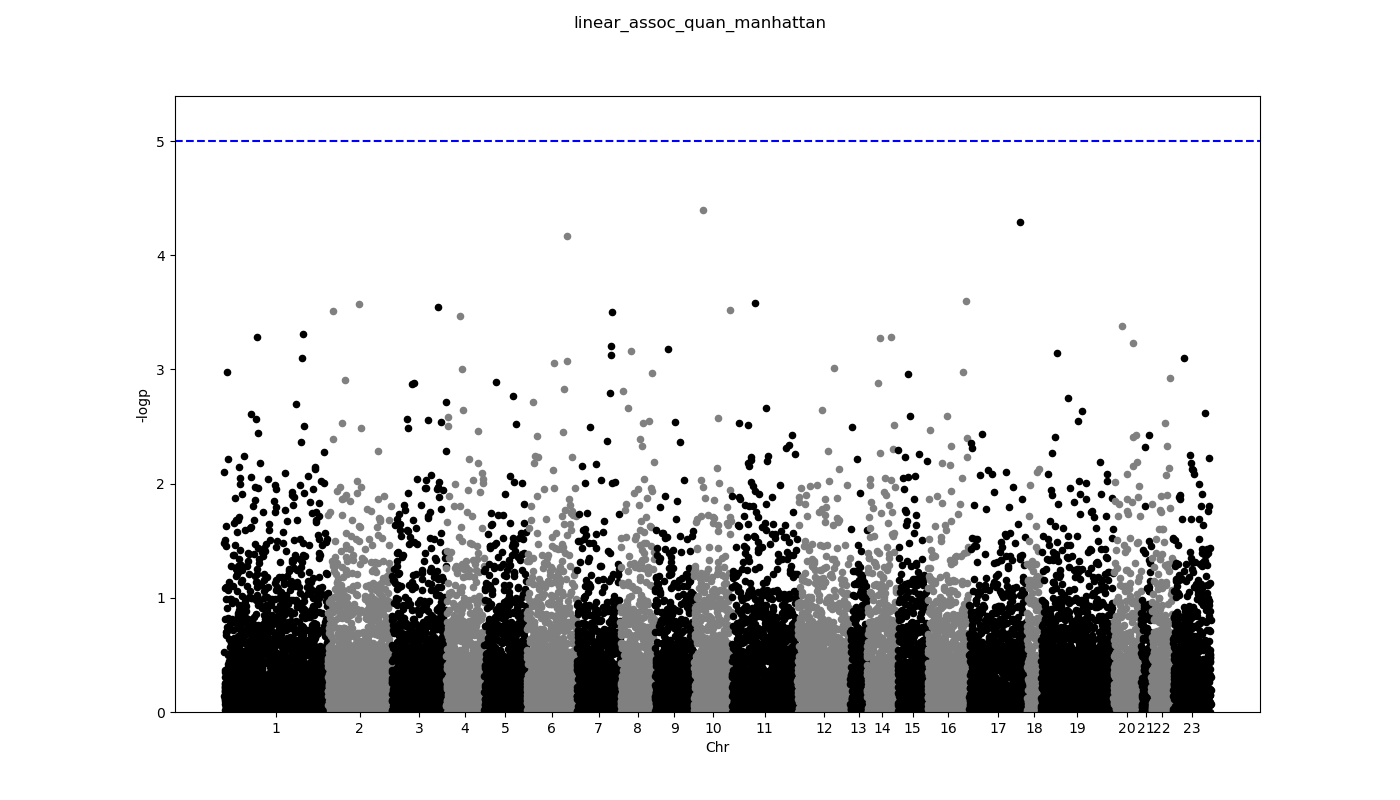
Manhatten plot of quantitative phenotype:
Machine learning models
We have created two types of models, regression and classification. Both models use the gene-based scores as features along with covariates. For the regression model, a quantitative trait was generated, while a binary trait was generated for the classification model. For each model, 10 fold cross validation was done on training dataset and an extra evaluation step was done on the testing set. The input for the model generation can be found here.
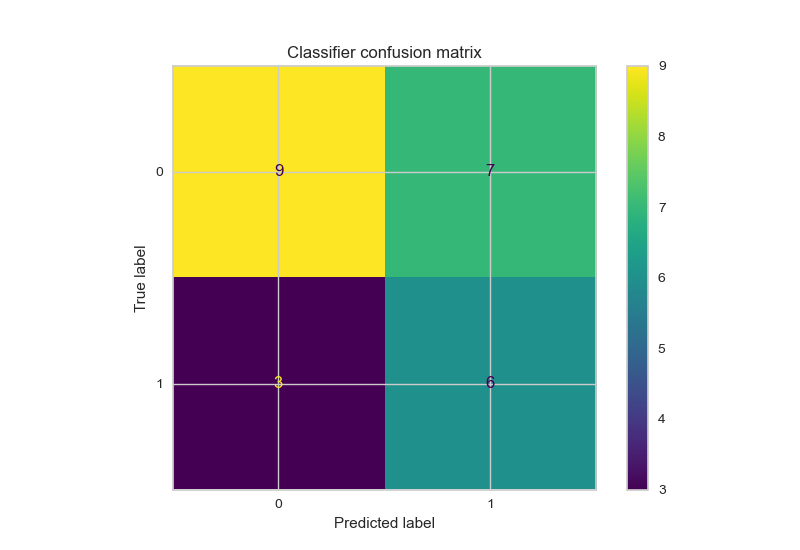
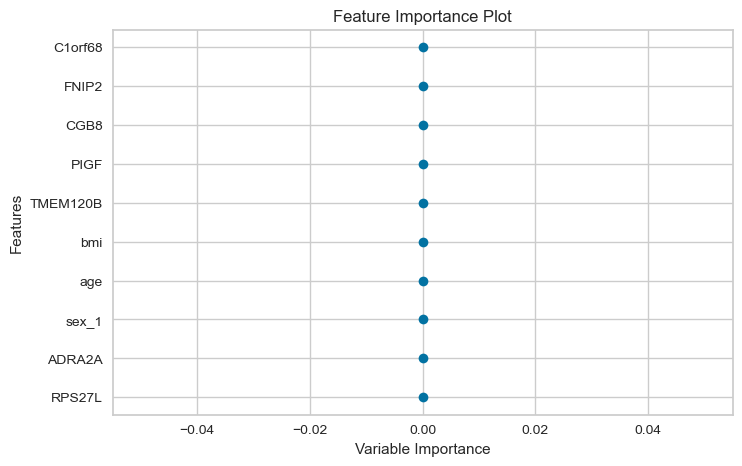
Classification model
Results of model training
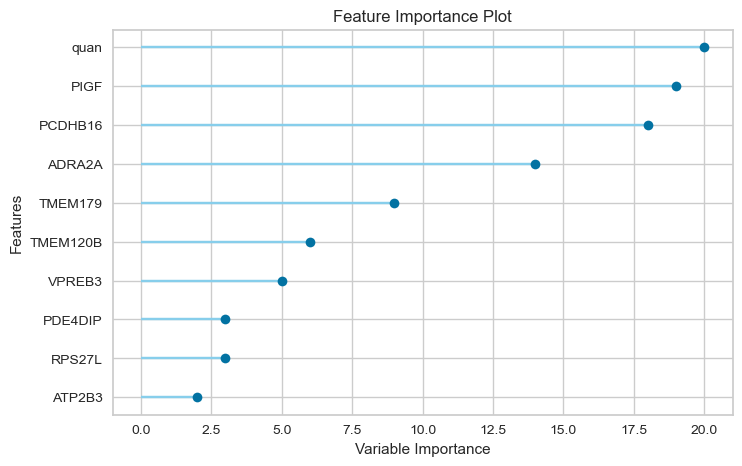
Feature importance:
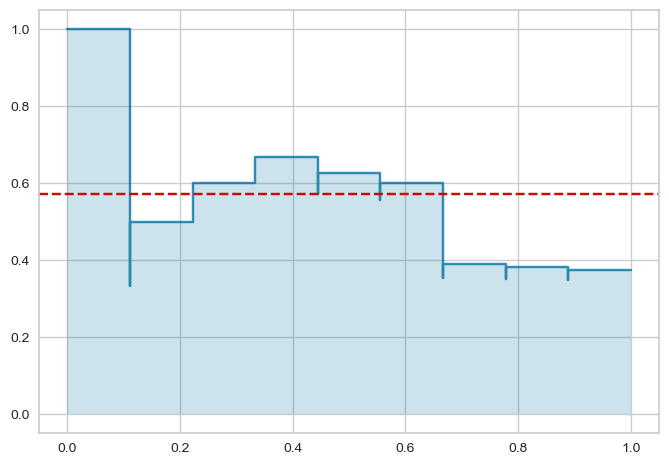
Precision-recall curve:
Confusion matrix:
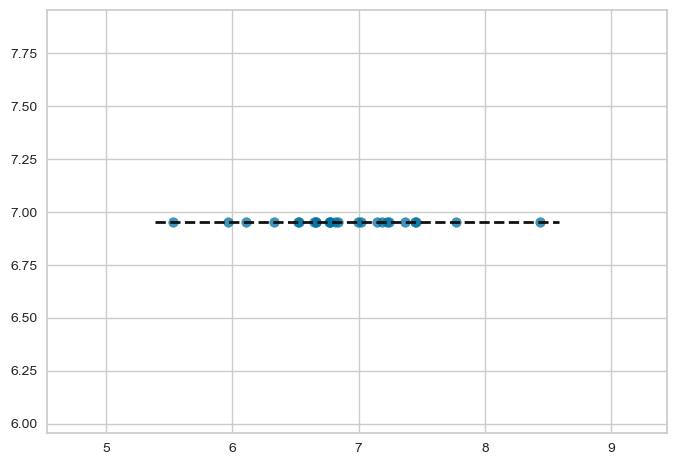
Regression model
Results for model training
Feature importance:
Prediction error:
Residuals: