Real use case
LDL Phenotype
We performed the analysis on the samples with LDL direct measurements as phenotype(quantitative).
Note
For this phenotype we adjusted the values for individuals who take statin.
Association analysis
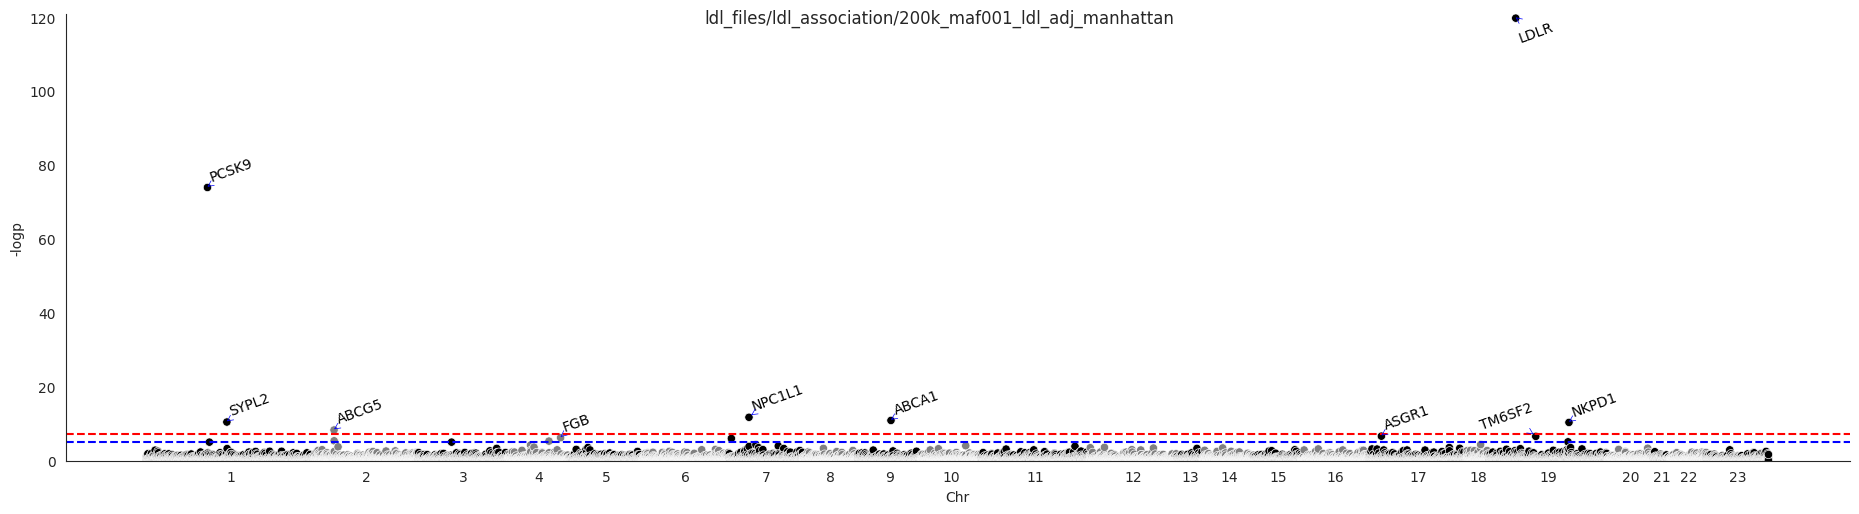
The association analysis highlighted PCSK9 and LDLR as significant genes, both are known to be associated with LDL. QQ-plot and Manhattan plot are presented below.
The QQ-plot:

The Manhattan plot:
Regression model
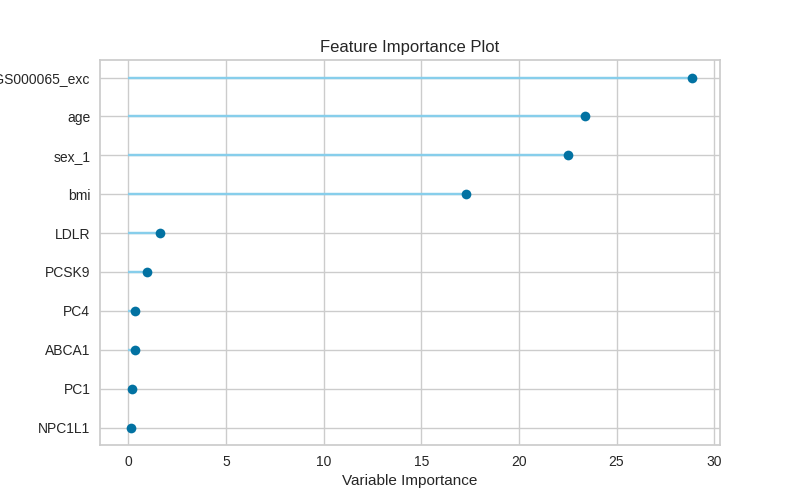
For the prediction model, we used LDL direct measurements (adjusted for statin) as target. For features, we used the scores of 3 selected genes + BMI + age + sex + PC1-4. For the PRS and combined models we used the following PRS (PGS000688). The final prediction models was generated using gradiant boosting regression, evaluation metric are shown in the table below.
Gene-based model |
PRS model |
Combined model |
|
|---|---|---|---|
Rˆ2 |
0.092 |
0.322 |
0.321 |
RMSE |
0.849 |
0.729 |
0.725 |
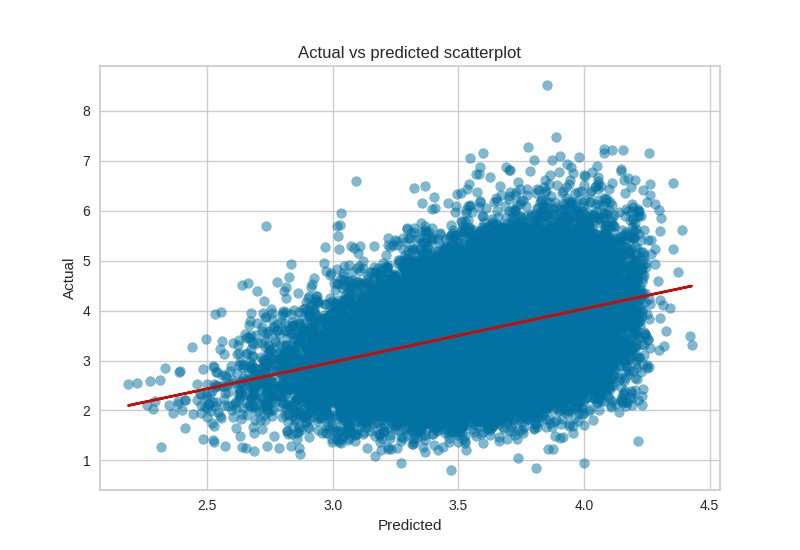
The images below are the output of the final combined model. Feature importance plot:
Actual vs Predicted:
Model residuals:

Alkaline phosphatase
We performed the analysis on the samples with ALP measurements as phenotype(quantitative).
Association analysis
We used linear regression for the analysis and age, sex, BMI and PC1-4 were used as covaraites. The association analysis highlighted ALPL, GPLD1 and ASGR1 as significant genes, all of which are known to be associated with alkaline phosphatase. QQ-plot and Manhattan plot are presented below.
The QQ-plot:

The Manhattan plot:

Regression model
For the prediction model, we used alkaline phosphatase measurements as target. For feature selection, For features we used 45 selected genes as features (45 genes) + BMI + age + sex + PC1-4. For the PRS and combined models we used the following PRS (PGS000670). The final prediction models was generated using gradiant boosting regression, evaluation metric are shown in the table below.
Gene-based model |
PRS model |
Combined model |
|
|---|---|---|---|
Rˆ2 |
0.084 |
0.255 |
0.281 |
RMSE |
24.7 |
22.3 |
21.9 |
Feature importance plot for combined model:

Other phenotypes
Association analysis
biomarker |
Top 3 significantly associated genes |
|---|---|
Alanine aminotransferase |
GPT, THRA, ACVR2B, More |
Albumin |
FCGRT, ALB, IQGAP2, More |
Alkaline phosphatase |
ALPL, GPLD1, ASGR1, More |
Apolipoprotein A |
ABCA1, LIPG, LCAT, More |
Apolipoprotein B* |
PCSK9, LDLR, NKPD, More |
Aspartate aminotransferase |
GOT1, GABRA5, THRA, More |
Cholesterol* |
PCSK9, LDLR, ABCA1, More |
C reactive protein |
CRP, PTGES3L, SLN , More |
Creatinine (in serum) |
NAA20, PRAMEF19, CLIC4, More |
Gamma glutamyltranferase |
GGT1, CCL1, RORC |
Glucose |
G6PC2, GCK, DYNLL1 |
Glycated Haemoglobin (HbA1C) |
HBB, PIEZO1, GCK |
Lipoprotein A |
LPA, PLG, MRPL18 |
Triglycerides |
APOA5I, APOC3, PLA2G12A |
values adjusted for statin
Note
summary statistics for biomarkers association analysis will be added soon.
Prediction models
Here we show a table of other phenotypes that we analyzed. For each phenotype we include the number of genes considered in the models as well as the Rˆ2 of the gene-based model, PRS model and combined model.
Number of genes |
Gene-based model |
PRS model |
Combined model |
|
|---|---|---|---|---|
apolipoprotein a |
6 |
0.227 |
0.413 |
0.403 |
apolipoprotein b* |
5 |
0.059 |
0.267 |
0.269 |
aspartate aminotransferase |
57 |
0.039 |
0.124 |
0.128 |
Cholesterol* |
6 |
0.088 |
0.229 |
0.236 |
Creatinine |
128 |
0.228 |
0.454 |
0.448 |
Hba1c |
13 |
0.100 |
0.242 |
0.247 |
lipoprotein a |
3 |
0.004 |
0.582 |
0.603 |
Triglyceride |
5 |
0.143 |
0.316 |
0.315 |
urea |
2 |
0.074 |
0.173 |
0.179 |
Urate |
4 |
0.396 |
0.521 |
0.534 |
values adjusted for statin