Pipeline functions
Gene scoring
- genrisk.pipeline.scoring_process(*, logger, annotation_file, temp_dir, beta_param, weight_func, del_col, maf_threshold, gene_col, variant_col, af_col, alt_col, bfiles, plink, output_file, vcf)[source]
Calculate gene-based scores. This is calculated by a weighted sum of the variants in a gene.
- Parameters:
logger – an object that logs function outputs.
annotation_file (str) – an annotation file containing variant IDs, alt, and another info.
temp_dir (str) – a temporary directory to save temporary files before merging.
beta_param (tuple) – the parameters from beta weight function. ignore if log10 function is chosen.
weight_func (str) – the weighting function used in score calculation.
del_col (str) – the column containing deleteriousness score or functional annotation.
maf_threshold (float) – the threshold for minor allele frequency. between [0.0-1.0]
gene_col (str) – the column containing gene names.
variant_col (str) – the column containing variant IDs.
af_col (str) – the column containing allele frequency.
alt_col (str) – the column containing alternate allele.
bfiles (str) – the binary files for plink process. if a vcf is provided no binary files are needed.
plink (str) – the directory of plink, if not set in environment
output_file (str) – the path to save the final output scores matrix.
vcf (str) – the vcf file for plink process. if binary files are provided no vcf is needed.
- Returns:
final scores matrix
- Return type:
DataFrame
Gene-scoring equation
The gene scores are derived by the weighted sum of the variants in a gene.
Di is the functional annotation (e.g CADD)
Ai is the weighted allele frequency
Ci is the allele count.
Weighting functions
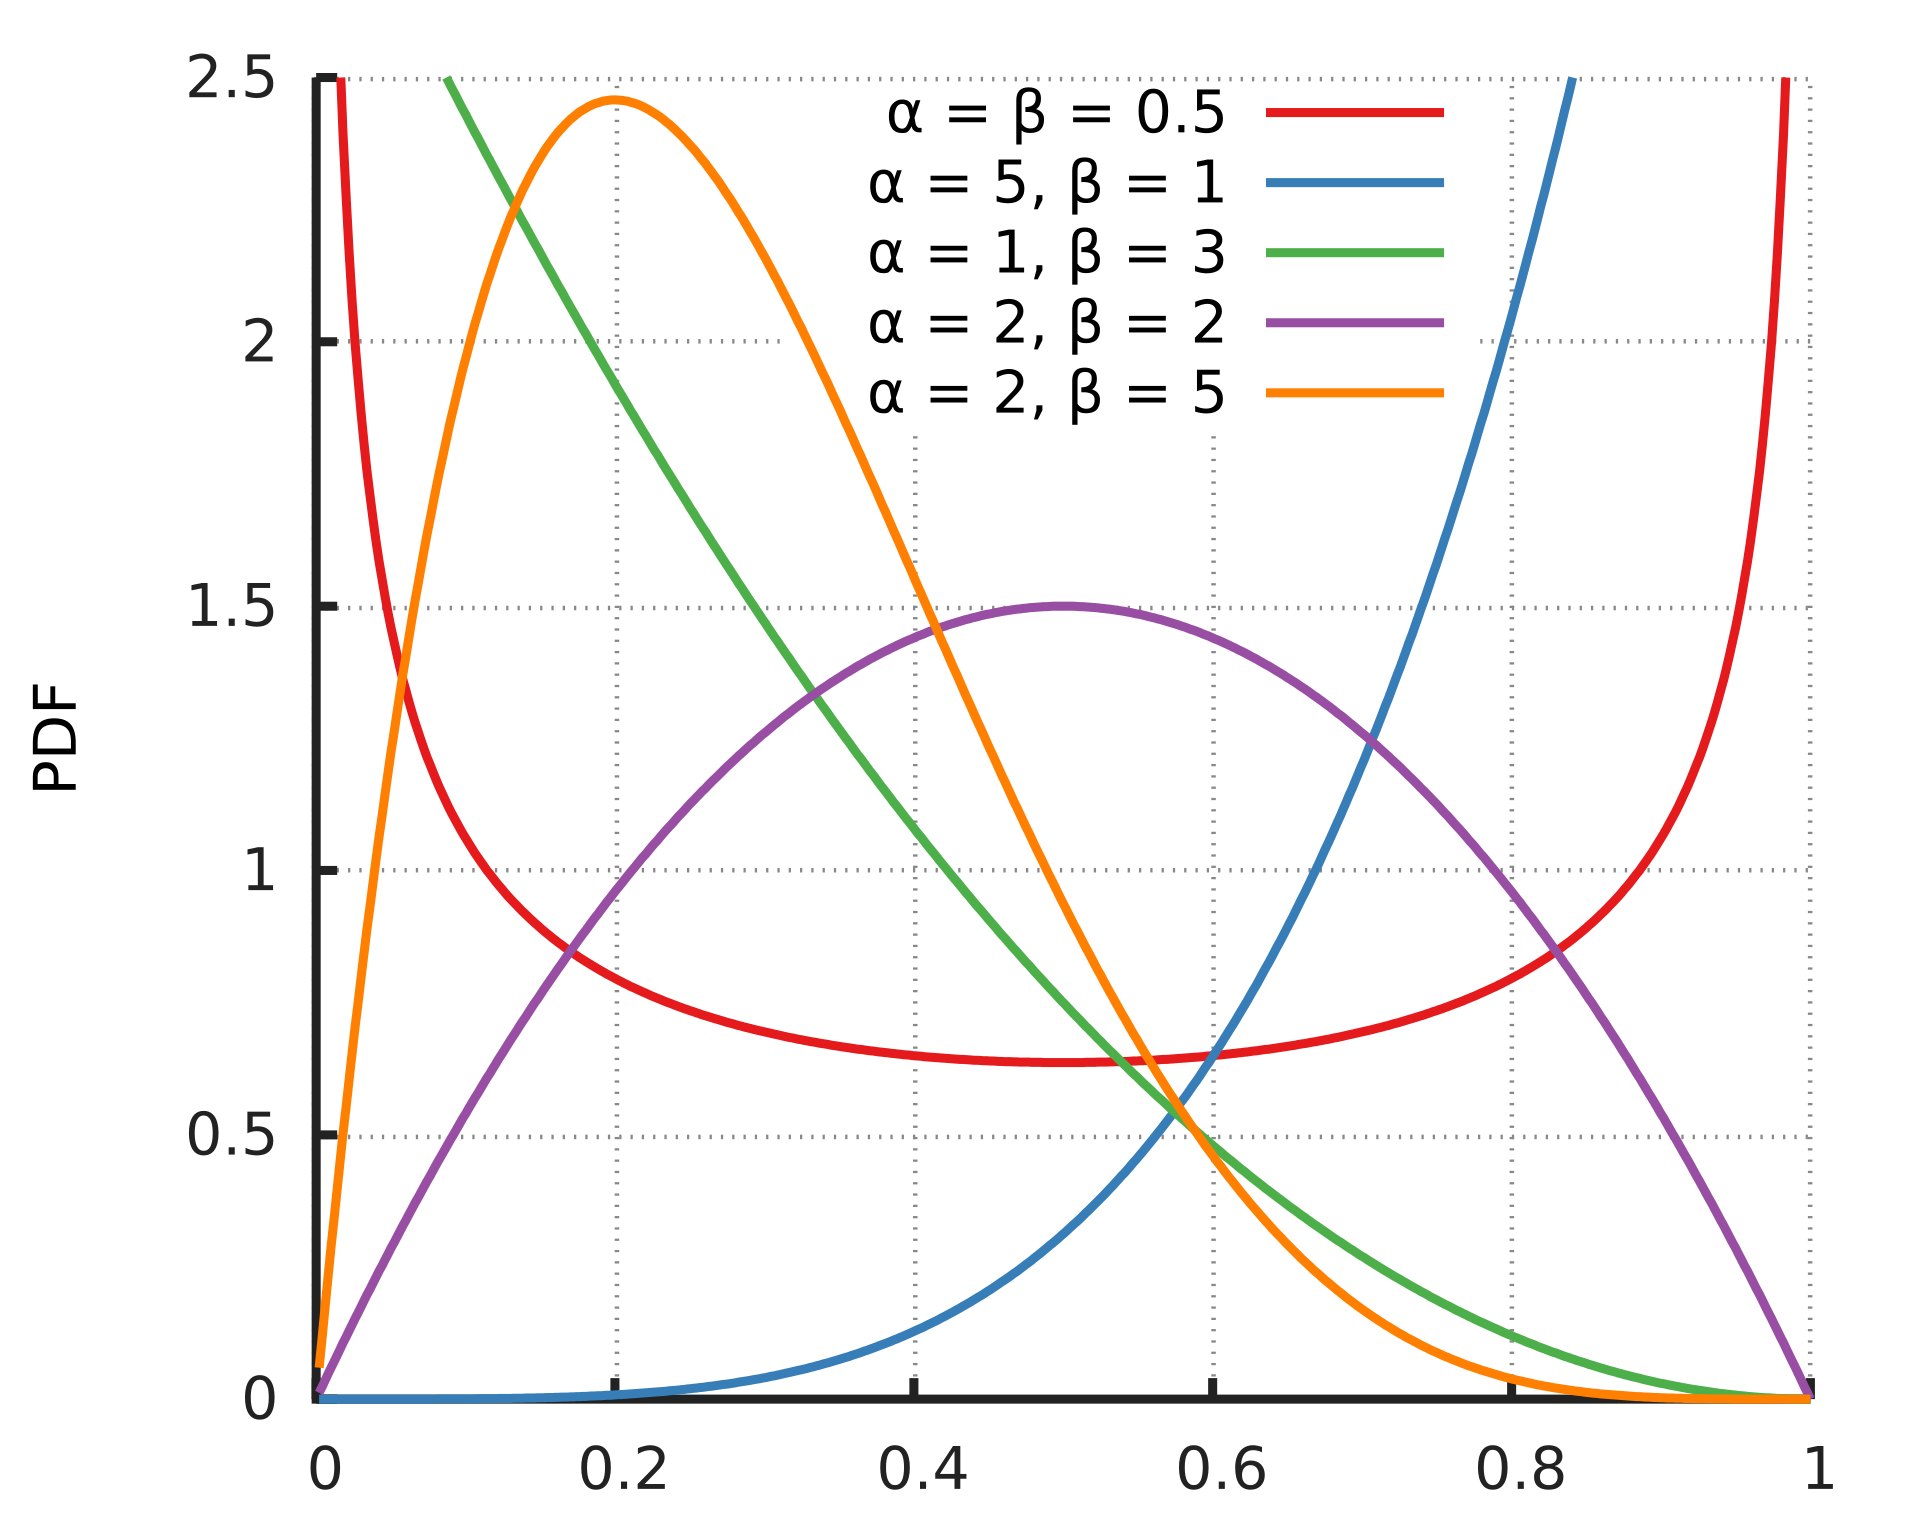
- beta:
this option uses two parameters α and β, to create beta distribution. Depending on the parameters chosen, the distribution can change its shape, giving more flexibilty for the user to chose how to weight the variables.
The default for this function is [1,25] which are the same parameters used in SKAT-O.
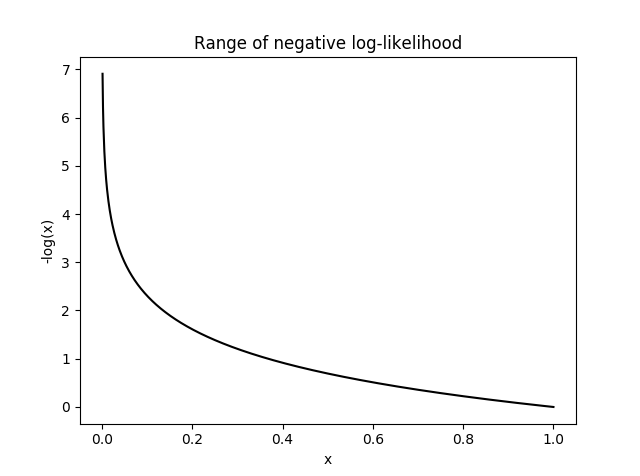
- log10:
this option uses -log distribution to upweight rare variants. This has been applied previously in another gene-based score tool
Data normalization
- genrisk.pipeline.normalize_data(*, method='gene_length', genes_info=None, genes_col='HGNC symbol', length_col='gene_length', data_file, samples_col)[source]
Normalize dataset using gene_length, minmax, maxabs, zscore or robust
- Parameters:
method (str) – the normalization method. [zscore, gene_length, minmax, maxabs, robust]
genes_info (str) – file containing the genes and their lengths. if gene_length method chosen with no file, info will be retrieved from ensembl database.
genes_col (str) – the column containing genes (if genes_info file is provided)
length_col (str) – the columns containing genes length (if genes_info file is provided)
data_file (str) – file containing dataset to be normalized.
samples_col (str) – the column containing samples ids.
- Returns:
a df with the normalized dataset.
- Return type:
DataFrame
Normalization methods
Multiple methods have been implemented to normalize a dataset. Below is a brief describtion of each function.
- gene_length:
This method divides each gene-based score by the length of the gene. The genes lengths can be provided by the user, or retrieved from ensembl database. The gene length from ensembl database is calculated as such: gene length = gene end (bp) - gene start (bp)
- minmax:
This method rescales the values of each column to [0,1] by using the following formula x`= x - min(x) / max(x) - min(x)
- maxabs:
In this method, the values are normalized by the maximum absolute to [-1,1] using the following formula x` = x / max(|x|)
- zscore:
This method uses the mean and standard deviation to normalize the values. Formula is x`= x - mean(x) / std
- robust:
Great choice for dataset with many outliers. In this method, the values are substracted by the median then divided by the interquantile range (difference between the third and the first quartile). Formula x`= x - median(x) / Q3(x) - Q1(x)
Every normalization method has it’s advantages and disadvantages, so choose the method that works best with your dataset. To learn more about the normalization methods, check out this helpful article
Association analysis
- genrisk.pipeline.find_pvalue(*, scores_file, info_file, genes=None, phenotype, samples_column, test='mannwhitneyu', covariates=None, cases=None, controls=None, processes=1, logger, adj_pval=None)[source]
Calculate the significance of a gene in a population using different statistical analyses [mannwhitneyu, logit, linear, ttest_ind].
- Parameters:
adj_pval (str) – the method used to adjust the p-values.
scores_file (str) – dataframe containing the scores of genes across samples.
info_file (str) – a file containing the information of the sample. this includes target phenotype and covariates.
genes (list) – a list of the genes to calculate the significance. if None will calculate for all genes.
phenotype (str) – the name of the column containing phenotype information.
samples_column (str) – the name of the column contining samples IDs.
test (str) – the type of statistical test to use, choices are: ttest_ind, mannwhitenyu, linear, logit.
covariates (str) – the list of covariates used in the calculation.
cases (str) – the cases category. if binary phenotype.
controls (str) – the controls category. if binary phenotype.
processes (int) – number of processes used, for parallel computing.
logger – an object that logs function outputs.
- Returns:
dataframe with genes and their p_values
- Return type:
DataFrame
Beta regression function
- genrisk.pipeline.betareg_pvalues(*, scores_file, pheno_file, samples_col, cases_col, output_path, covariates, processes, genes, logger)[source]
Calculate association significance using betareg. This function runs in Rscript.
- Parameters:
scores_file (str) – the path to the scores file.
pheno_file (str) – the path to the phenotypes and covariates file.
samples_col (str) – column containing samples ids.
cases_col (str) – column containing the phenotype.
output_path (str) – a path to save the summary statistics.
covariates (str) – the list of covariates used in the calculation.
processes (int) – number of processes used, for parallel computing.
genes (str) – a list of the genes to calculate the significance. if None will calculate for all genes.
logger – an object that logs function outputs.
Prediction model generation
- genrisk.pipeline.create_prediction_model(*, model_name='final_model', model_type='regressor', y_col, imbalanced=True, normalize=True, folds=10, training_set, testing_set=Empty DataFrame Columns: [] Index: [], metric=None, seed, include_models, normalize_method, feature_selection)[source]
Create a prediction model (classifier or regressor) using the provided dataset.
- Parameters:
model_name (str) – the name of the prediction model.
model_type (str) – type of model [regressor|classifier]
y_col (str) – the column containing the target (qualitative or quantitative).
imbalanced (bool) – True means data is imbalanced.
normalize (bool) – True if data needs normalization.
folds (int) – how many folds for cross-validation.
training_set (pd.DataFrame) – the training set for the model.
testing_set (pd.DataFrame) – if exists an extra evaluation step will be done using the testing set.
test_size (float) – the size to split the training set for cross-validation.
metric (str) – the metric to evaluate the best model.
seed (int) – the intilization state random number
include_models (list) – a list of models that the user wants to test. if None all models will be used.
normalize_method (str) – the method to normalize the data. Choices [zscore, minmax, maxabs, robust]
- Return type:
Final model